SPRINT: HOW TO SOLVE BIG PROBLEMS AND TEST NEW IDEAS IN JUST 5 DAYS

Sprint_Jake_Knapp_v1.1While mentoring and coaching digital health start-ups, I have come across some business models and products that are just a bit “off.”  By “off”, I mean they may not have fully thought about how the customer would use their product or service – a poor product-customer fit.  In some cases, they are targeting B2C when they should be going B2B.  Why does this happen?  In one particular case, I was working with a team of men engineers who were trying to fit their technology into a baby wearable.  They did not have women fully represented on their team!  Such incidences such as forcing a tech/product on a customer results from a general gap in understanding of the customers and their buying process/decision making.  What I have found helpful in coaching such teams is to go through a Sprint process with them.  Based on the book by Jake Knapp from Google Ventures, Sprint is a rapid prototyping and learning process to help start-ups and innovative companies fill their knowledge gaps in the white-space.  The true power is in engaging with potential customers and truly listening and learning from their feedback.  Through this Sprint, teams can then fine-tune and course correct their products and services.

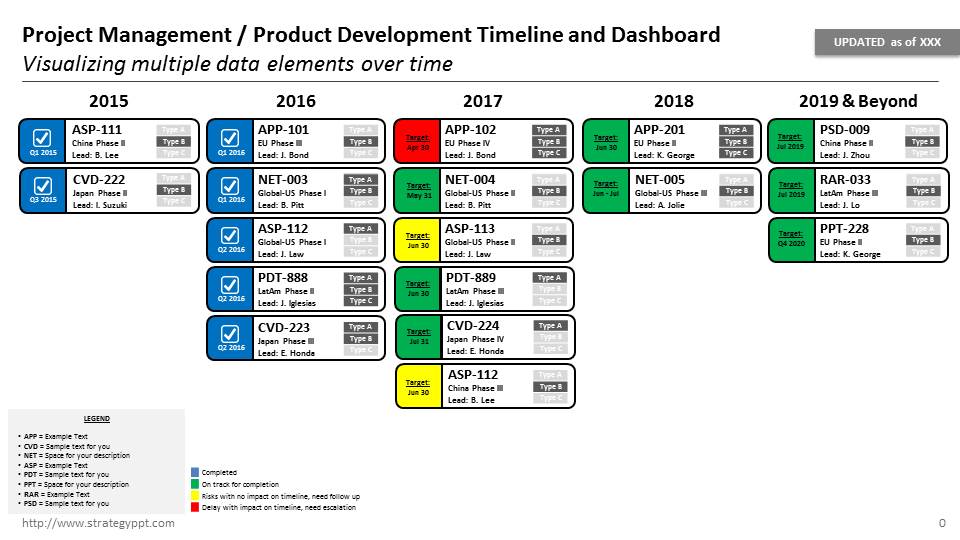
Click here to download the slide in PDF..  If you would like to get the PPT, just email me at info@strategyppt.com and I’ll send it to you in less than 24 hours.  As always, I recommend you purchase the book and read it in detail.  You can get it here at amazon.

Sprint_Jake_Knapp_Book

In addition, Jake wrote an awesome blog post (click here for full post) about why the Sprint process works better than traditional Group Brainstorming.  I have excerpted it here in the table below:

Brainstorm Problem Sprint Solution
Shallow ideas from the group.  In a group brainstorm, ideas are shouted out loud, rapid fire. The goal is quantity, with the assumption that there will be diamonds among the coal. But details matter, and good ideas require time for deep thought. Detailed ideas from individuals. In a sprint, each individual considers several approaches, then spends an hour or more sketching their solution. In the end, there are fewer solutions than in a group brainstorm, but each one is opinionated, unique, and highly detailed.
Personality outshines content. If somebody has a reputation for being smart or creative, their ideas are frequently overvalued. And a group brainstorm can be a nightmare for an introvert. Charismatic extroverts who give great sales pitches often dominate. Ideas stand on their own. The sketches in a sprint don’t have the creator’s name on them. And when we critique them on Wednesday, the creator remains silent and anonymous, saving any sales pitch until after everyone else has given their opinions.
Groupthink. The collaborative, encouraging environment of a brainstorm feels good, but often leads teams to talk themselves into watered-down solutions. Opinionated decisions.  In a sprint, decisions are made by one person: the Decider. With the Decider in the room making all the calls, the winning solutions stay opinionated.
No results.  Worst of all, brainstorms result in a pile of sticky notes — and nothing else. It’s a loose methodology to begin with, and there is no map to get you from abstract idea to concrete implementation. A prototype and data, every time.  The sprint process requires your team to build a prototype and test it. By the time you’re done, you have clarity about what to do next.

As usual, don’t just take it from me, check out Jake Knapp in his own words as he speaks about the Sprint Process.

Give and Take

Recently, during the course of my consulting practice, I referenced and referred this great book to multiple clients and colleagues.  The general premise or problem  was this: burn-out at work from doing / “giving” too much, frustration with a work culture or leader that rewards the “takers” (people who talk a lot bs but don’t do/know anything.)

The insights from this book is simple: Be kind and helpful to others — a universal truth.  However, if you are a giver, someone who loves to help people, this gift of giving can become a weakness, a disadvantage especially in the corporate working environment.  The data collected from Adam Grant’s study reveal that there is a bi-modal distribution of “givers” in an organization — they are the worst performers and the best performers.  The key insight here is to understand the differences between those givers at the top and the givers at the bottom.

For your reference, I have created a one-page summary slide for you to download and use here.   Of course, I recommend you buy the book and read it as well — you can get at Amazon.

Give_and_Take

In addition, here are few cool videos from Adam Grant himself describing the concepts of his book.

If you don’t have 13 mins, here’s an even quicker/shorter version here on Inc.com.

Lastly, another helpful resource is Adam Grant’s website for this book.  There is a really cool Inforgraphic summary.  Enjoy!

More Project Timeline Templates

This slideshow requires JavaScript.

Due to popular demand, I have posted 2 more PowerPoint Project Timeline templates for you all.  The first slide is a timeline created using a super easy tool and PowerPoint add-on called “Think-cell.”  This add-on allows users to easily create a Timeline and now there is some basic integration with Excel.  However, I suggest that you keep things simple in PowerPoint as it is meant for presentation and communication purposes.  And if you are using it for communications, especially for Senior Management presentations — I would suggest you keep it very basic — a rule of thumb would be to have no more than 20 rows of activities for the slide.  You can download a free trial of “Think-cell” for 30 days here.  In addition, I have a slide for comparing 2 different Timeline options.  Typically, I have been asked by clients to compare various options — with the key factor being the timing to launch or completion of the project.  This is one of my most popular slides as it summarizes the 2 choices with additional space for Pros & Cons.  You can download my slide templates here.

Please also see a quick youtube instructional video for making Gantt charts in PowerPoint.

Designing Your Life

This slideshow requires JavaScript.

In my recent meeting with the Chief Digital Officer of a top tier media agency, we talked about the how we both love Digital but some things are still better the “old” analog way.  The Designer’s process of thinking and solving problems are still very relevant and applicable today as Digital is not always the “answer” for everything.  This led me to recommend this great book from 2 Stanford Design Professors who applied Design Thinking to the area of “Self-Help” and Career Planning.

Attached is my own PowerPoint summary of the book “Designing Your Life” by Bill Burnett and Dave Evans.  It is not a direct copy of the book’s outline but rather I pulled out a couple of key concepts and tools that I found to be really helpful.  I highly recommend that you buy the book and work through it personally here.

designing_your_life_cover

“Designing Your Life” – Key Takeaways from the Book:

  • Health, Work, Play, Love Dashboard – Take a pulse check on the state of Four important aspects of your life.  
  • Good Time JournalTrack your daily activities Where you are/have: (1)Most Engaged, (2)Most Energy.
  • Brainstorming & Mind-Mapping – Brainstorm on the activities where you are/have most engagement and most energy.  Capture it in a “Mind Map.”
  • Creating Scenarios via Odyssey PlanFrom your Mind Map, Create different alternative futures of your life through the “Odyssey Plan.”
  • ProtoTyping – Test concepts from your Odyssey plan and try to answer questions from your alternative futures via rapid Prototyping approach. 
  • Fail Fast / Fail Forward – Fail quickly and learn from it so that you can move forward in designing your life. Become Failure immune.
  • Meet People and Do lots of Informational InterviewsMeet People who Can help you to Prototype.  Conduct Info  interviews to find “unlisted” opportunities.
  • Build Your Support CommunityFind your support team who will encourage you and keep you accountable.  

You can download the ppt template here.

As always, you can watch a quick video clip from Bill Burnett and Dave Evans themselves about the book.

Data Transformation (ETL) to Data Analytics and Visualization without a database

This slideshow requires JavaScript.

While doing consulting work for a “start-up” client, I came across a situation where there were multiple sources of external data (from various different geographies) that needed to be quickly aggregated together for internal analysis and management decision making.  Because the client was a start-up, they never had any database infrastructure in place.  The long term solution would be to build a data warehouse/BI solution that would be fully integrated with api’s from data providers — however, this solution would take time; on the order of 1+ years given the number of different data sources over many different countries.  Due to the urgent business need, I proposed a quick-win solution by piecing together a few technologies:

  • A flexible and nimble ETL automated solution (Alteryx)
  • Instead of creating the standard “database”, we created a “cleaned” master excel file from the ETL with interim files hosted on cloud storage (e.g. Box, Dropbox) while software was put on a virtual server via AWS (Amazon Web Service)
  • Lastly, we then output the normalized “master” to various Data Analytics/Visualization tools (e.g. Tableau / Qlik)

The output looks great with the awesome Visualization tools and no one knows that it is working off a excel spreadsheet.  The key to this is the automated ETL, Alteryx.  Years ago, the focus of IT was on creating a centralized and standard database.  But now, as data sources multiply and data standards change rapidly, I posit that the key focus for IT should be on a flexible, nimble and automated ETL.  Please click here to download my slide templates illustrating the typical challenges of multiple data sources and the resulting solution archetypes.

Furthermore, here is a guidebook that you can find on Amazon here.

apractitionersguidetoalteryx

But you can probably learn more by viewing this quick product intro video:

Better yet, you should download a free trial and play with it yourself via the link below.  If you have any questions, feel free to email me (info@strategyppt.com) with any questions about this.

try_alteryx_for_free

Project Management Timeline Dashboard

ProjMgmt_Slide0

Throughout the course of my consulting career, I have had to create many project timelines.  Typically, I would create gantt charts in MS Excel or MS project.  The problem is that project timelines are inherently not good visuals for presentations.  Often times, the challenge is to summarize the details into a slide for management to understand the key issues/risks.  Hence, I like to call it a timeline + dashboard (time-board or dash-line).  Time is on the Y axis, and generally, I would bound it in years or quarters and/or months (I wouldn’t go to smaller increments of weeks or days – which is typically too detailed).  Then I would depict the activities in boxes.  In the example attached, each Box is a Product (e.g. Pharmaceutical Product Development timeline/dashboard) but you can use it for whatever task that needs to be completed (e.g. Contracts that need to be signed, Country launches or “go-lives”, roll-outs of software functionality, etc.)  Within the boxes, I put different types of info:

  • Status: Red/Yellow/Green/Blue traffic lights to denote risk and/or completion status
  • Lead or Owner: Allows management to quickly see who is responsible and to see if there are any resource constraints.
  • Product Names or Activity Names: Visual way to see where the products are over your timeframe.
  • Type: In case you need to show additional information about the products, there are radio type buttons to visually help management understand further categorization.

I hope this template is helpful for you, please download it here.

In addition, I have been recently fascinated with Data Visualization and I would highly recommend this book, Storytelling with Data: A Data Visualization Guide for Business Professionals by Cole Nussbaumer Knaflic.  The book can be found here on Amazon.

Cole provides really practical examples of how to improve your data/charts via shapes and color and tips on how to focus the reader’s attention.  Please also check her workshop on this topic at Google:

Gallery

5 Dysfunctions of Teams

This slideshow requires JavaScript.

While working for a client, I was once asked to put into a slide all the “problems” of a dysfunctional team.  As a consultant for over 15 years, this was one of the most difficult tasks that I have been asked to do.  How do you put all these issues down without offending specific team members?  How to make this slide without looking like a list of grievances and no solutions?  How do I make the slide without me sounding as if I’m the know-it-all and judge?  In order to make this slide, I looked for first for a “framework” that can help to diagnose High Performing Teams from Dysfunctional Teams.  The framework becomes the “judge” without it becoming personal or condescending.  The 5 Dysfunctions of Teams by Pat Lencioni was the “perfect” fit for this situation.  Please click here for the free slide template.  Slide 1 describes the 5 Dysfunctions in a Pyramid structure with examples on either sides — framed in Positives (High Performing Teams) vs. Negatives (Dysfunctional Teams).  Slide 2 is where you can put down specific “issues” (Negatives) and present the alternative solutions — presented as Recommendations or Mitigations (Positives).

I highly recommend the book by Patrick Lencioni which is filled with great illustrations and examples.  Here is the link to the book on Amazon.

There is a manga version of this book for those of you who work with Japanese teams.  It is particularly relevant for Japan because it is strictly forbidden in their culture to be so “direct” in presenting the “Dysfunctional” behaviors.  This offers a way to steer the conversation towards improving team dynamics and avoiding personal attacks, which can be viewed as public shaming – a big “no-no” in the Japanese workplace.  Here is the link to the manga illustrated book on Amazon.

Lastly, if you have about 30 mins time, please check out the video of Patrick Lencioni explaining the concepts of the 5 Dysfuctions here.

Asia Business Development Template

This slideshow requires JavaScript.

Many US and European companies have tried and failed to successfully enter into the Asian Market.  Asia which includes the #2 (China) and #3 (Japan) economies in world is full of opportunities, not only for its market and population size but also serves a rich source of talent and capabilities, both technological (e.g. Shenzen’s manufacturing) and business processes and systems (e.g. Toyota’s Lean and Six Sigma management techniques).  With much rewards, there are also many perils for any business trying to enter into these markets for the first time.  Attached are some slide templates for your use to help you layout your roadmap for entry into this exciting region.  Please click here to download this free PowerPoint template.

I highly recommend the book How Asia Works by Joe Studwell.  It contains a wealth of information about the history of financial flow and demographic movement of the people across the countries of Asia.  Link to Book on Amazon.com

book_how_asia_works